Getting started with Aggregations in Power BI - Part 1
- Antriksh Sharma

- Mar 10, 2022
- 7 min read
In this article let's take a look at how to get started with aggregations feature in Power BI. I will try to explain aggregations in a way that it is easy to understand and implement.
So what are aggregations? Simply put they act as a
Supporting Fact table in the model that are less granular than the Main Fact table.
Replacement for the Fact Table during the query time of your report
Way to assist you to optimize the performance of your report (DAX Formulas)
So in your model you might have a Fact table of 12 Million rows but the performance could be really slow, in that case you can have a new Fact table that will have limited columns and limited rows and will have additional columns that will be aggregated at the level of granularity of the columns that will be used in the report.
Let's say you have a data model that contains 2 tables Products & Sales.
In the Products table you have 2,517 rows and ProductKey is the Primary Key of the table
In the Sales table you have 12.5 Million rows and ProductKey is the Foreign Key
And you try to run a complex calculation that takes several minutes, because the DAX Engine has to scan the fact table and ocassionally materialize more rows than the granularity of the Visual, in this case let's assume you have only 11 Brand in the Matrix.
Their is a possibility that the DAX Engines are materializing around 5 Million rows (Hypothetically speaking) then there can be performance bottlenecks and your goal will be to match the granularity of the report with the granularity of the data cache that is extracted from the Storage Engine.
In such scenarios Aggregation tables are really useful as in those cases you will group the metrics in the Sales/Fact table to one row per ProductKey and the resulting table will be of about 2,517 Rows or less, so you can assume that it is better to materialize 2.5K rows vs materializing 12.5M or 5M Rows.
FYI - Materialization is the process of scanning the compressed data in Storage Engine and then storing the same data in an uncompressed format on the RAM. You need enough RAM for this operation if you are working with Billions of Rows.
Now after this bit of boring theory let's start with setting up aggregations in our Model.
I am using Contoso Retail database that has been provided by Microsoft, it contains 12.5 Millions rows in the Fact Table which is enough for some performance testing and the purpose of this article.
System configuration & softwares used :
SQL Server 2019 Developer Edition
Ryzen 5 2500 6 Cores 12 Threads
16MB RAM 3000 Mhz
Windows 10
Power BI Version: 2.103.661.0 64-bit (March 2022)
DAX Studio 2.17.3
Important Note - Before we start let me tell you the most important thing about Aggregations, the Detail Table (The table because of which we are going to create aggregations) needs to be either in DirectQuery mode or Dual Mode otherwise as of today Aggregations are not supported for tables completely just in Import Mode.
So we are going to connect to SQL Server and use DirectQuery mode to connect to 3 tables:

Now let's prepare a basic report that allows us to slice Sales Amount by Brand Column from the Products Table.

So at the moment everything is working in DirectQuery mode and in case if you don't know how a DAX Query is executed, here is a quick recap.

Now I we can see that the query works but is it fast enough to answer frequent changes in the report and display them correctly? For that we need to enable Performance Analyzer and gather the metrics.

I going to copy the query from above Performance Analyzer and paste it inside DAX Studio and switch on Server Timing to gather how much time it takes to run this query to Populate the matrix with Brand and Sales Amount.
When you copy paste the query to DAX Studio, it will detect both DAX Query and SQL Code used to fetch the data from SQL Server, both are important as former help in understanding performance numbers and latter helps in executing the same query in SQL to generate tables.

The DAX Query you will see is a bit complex as it involves:
DEFINE - defines the Variables
ROLLUPADDISSUBTOTAL - that is used for computing grand total
TOPN - that is used to limit maximumn number of rows that are shown to a user at once.
EVALUATE - fires the DAX Code and,
ORDER - simply orders the end result set.

But since we are not going to return Millions of Rows I am going to clean up the query and when I run the query it shows that there is one query and it takes around 1.9ms to execute the code.

You can copy the SQL Code and run it in SQL Server and you will see the same result:

Now the real fun starts, as you can see for a basic SUM it takes 2 seconds to execute the code, think how much time it will take for more complex queries, so what we can do? We can Import a new table in the Model that will contain only 11 Brands and Sales Amount.
We are going to try different options for this and the First one is to use Power Query, because let's say we don't know SQL much.
Creating Aggregation Table Using Power Query
So here is the table that I have prepared in Power Query

If you are interested in the code that I have used, this is what I used:
Just like other tables, this table is also in DirectQuery mode:

Now, it is time to setup the aggregation, and for that click on the 3 dots on the Aggregated tables and select Manage Aggregations.

Then there are 4 headers:
Aggregation Column - The column in the Aggregation table that will be used for optimization.
SUMMARIZATION - The kind of aggregation you want to perform, the options are COUNT, GROUP BY, SUM, MIN, MAX, Count Table Rows.
Detail Table - The tables in the DirectQuery mode
Detail Column - the Alternate of Aggregation Column
So for the BrandName column this is how the setup will look like:

But if I try to map the Sales Amount Column of AggSalesByBrand table to Sales Table, I am not able to select anything.

The reason is there is Data Type Mismatch, and I wanted to show you this by making a deliberate mistake. When setting up aggregations, the data type of the Aggregation Column and the Detail Column of the detail table should be same, and in this case Sales Amount Column in the Sales table is of Fixed Decimal Number where in the Sales Amount Column in AggSalesByBrand table is of Decimal Number or the Currency type, so we need to change the data type in one of the column, best option is to change in Aggregation table.

Now we can try to map the columns and it will work

After this click Apply All and let's test the performance. The aggregation table will be hidden automatically.

And now in the above image you can see that we have optimize the query time reducing total time spent from 2 Seconds to around 300 ms.
Also notice there are few useful information in the image:
RewriteAttempted - This helps in confirming if the Aggregation Table was used or not
Match Result - This tells the status if whether Aggregation was found or was failed?
Original Table - This tells the table against which the queries were executed
Mapped To - Tells the table that acted as the aggregation table.
Details - Provide more information in JSON format, i.e.

So you can see that how easy it was to optimize the calculations in the DirectQuery mode with the help of Power Query, But the problem with this method is that it is not extremely efficient and the reason being we have created the the Aggregation table using Power Query and this is not a Physical Table in the model so every time we run the DAX Query for our report the JOINS that we have performed in Power Query will be evaluated and thus it will slow down the performance considerably.
Here is the SQL Statement that was used to get Brand and Sales Amount when we run the DAX code.
You can easily notice the Join on line 40 that is performed because of the Merge step in Power Query.
Creating Aggregation Table Using SQL in the Database
To create the table in database first we create a Schema so that we can easily identify the Aggregations table.
Next we need to create a SQL Code that will create the same table that we have seen so far.

Finally, to generate a physical table in the model we need to insert it into a table and easiest way is to use this code.

Now we are gonig to connect to this table in the data model and I have removed the previous Agg Table to simplyfy the model.

We need to follow the same process of mapping the column and setting up the Aggregation.
Now if we go back to DAX Studio and run the DAX Query we can see that it take between 4 - 10 ms to run the whole query and display the result to the end user.

And the SQL Query that is now getting executed is very simple.
And just to be sure whether if the timings are correct or not I ran the same query with the help of Run Benchmark feature of DAX Studio both with Cold and Warm Cache and here the results and statistics.
Summary:
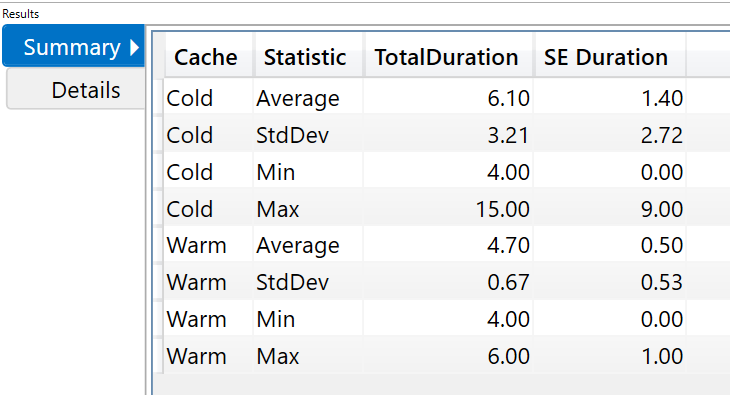
Details:

So you can see that when we are clearing Cache the Average Execution time is 6.10ms with Maximum being 15.00ms and when we do not clear the Cache the Average is 4.70ms with Maximum being 6.00ms
So in this article we have see how we can optimize queries in DirectQuery mode by setting up aggregations,
Just to recap the performance optimizations that we have done -
Without Aggregation Table - 2 Seconds to compute the result
Aggregation Table with Power Query - Approx 300 milliseconds
Aggregation Table in Database - Approx 10 milliseconds.
Now this was just an introduction to Aggregations and setting up Aggregations in Power BI, in future articles we will go much more deep into performance and other aspects of Aggregations that are not covered in this article.


Comments