How To Exclude Slicer Selection from the result with DAX in Power BI
- Antriksh Sharma
- Apr 9, 2021
- 7 min read
Updated: Oct 1, 2021
One of a very common requirement that I have seen is to be able to filter out the selection made in the slicer from a visual such as a Matrix or Table in Power BI.
Below is the snapshot of the data model used:

The default behaviour Power BI is to show values that are selected in a slicer.
So if a create a report like the following one:
And if I make some selection over the slicer then the Matrix will only show the values selected in the slicer:
But what the user wants to achieve is kind of inverse selection like the following:

So how can we achieve the inverse selection? The first thing to do is to create a disconnected table that contains the Brands that I have to use in the slicer.
I have created one such table using DISTINCT
Updated model after adding DisBrand table:

Now why do we need a Disconnected table? I will answer the question towards the end as it involves more technical details. Note that this isn't the only approach, Disconnected tables are one way to deal with this, but there are other ways to achieve the same behaviour by just using measures and filter pane. However, the goal of this article is to show the technique with Disconnected table.
Now with this Disconnected table we can create our slicer and create a DAX Measure.

Now that the layout of our report is defined let's start with the code of the measure.
I am going to name the new measure as "Sales Except Selected Brands 2"
First we need to create a variable and this variable will simply get all the Brands that are selected outside of the Matrix.
The next thing to do is get all the Brands that are in the Products table:
Once we have both list of brands from Disconnected Brands and the Products table what we need to do is to do SET operation and remove the brands that are available in the SelectedBrands variable, so for that we can use EXCEPT function.
Now all we need to do is to evaluate any measure of our model by applying the ExcludeSelectedBrand variable to the filter context inside CALCULATE.
Here is the combined code:
Now let's see what this returns:

If you pay attention you can see that we get the same value in the each cell of the report, why is that?
The problem is that the ExcludeSelectedBrand variable contains 6 Brands and when those Brands are applied to the Filter context, CALCULATE overwrites the existing filter context so if we are at Contoso the Initial Filter context is something like this:
But when we inject those 6 values into the filter context this is how the code looks like:
So if you don't know here is how CALCULATE works with nested filters,
Two filters in same CALCULATE will Intersect
However in case of two filters in nested CALCULATE the Inner CALCULATE overwrites the filter context created by Outer CALCULATE unless you use something that doesn't overwrites but instead creates an intersection.
So if you write DAX like the following:
Then both Contoso and Fabrikam will be evaluated in an AND operation, but in this data model that would result into BLANK as there are no products that belong to both Contoso and Fabrikam but in your models that could be True.
But when you write DAX like the following:
Then the filter created by inner CALCULATE containing Fabrikam will overwrite the filter created by the outer CALCULATE with Brand = "Contoso"
I hope the behaviour of overwrite feature of CALCULATE is now clear, so how can we modify our ExcludeSelectedBrand to not overwrite the existing filter context but do an intersection between Contoso and the 6 brands that we have inside ExcludeSelectedBrand?
We can use KEEPFILTERS and modify the code in the following way:
Now the updated version of the code looks like this:
KEEPFILTERS prevents CALCULATE from overwriting the filter context and will merge the filter context outside CALCULATE and inside CALCULATE.
This is how the report looks after using KEEPFILTERS:

Need for Disconnected table
Now that we have a report that works as inteded, let's understand why we needed to use Disconnected table in the first place.
The reason is that the axis of our report is created by grouping Products Brand which is done behind the scenes by SUMMARIZECOLUMNS ( that's why it is called as a query measure, as Power BI is using it to generate the table and uses it to populate the data in a visual, not every visual uses SUMMARIZECOLUMNS but some do )
When we use Brands from the Product table in the slicer and we put a filter on it, then the axis of our visual is evaluated in the filter context coming from the Slicer so if we select Contoso in the slicer You can see that the matrix only shows Contoso:
Below image shows the effect of slicer on the matrix when the column in slicer is coming from Products[Brand]:
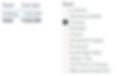
So if the matrix is filtered before our [Sales Except Selected Brands 2] measure kicks in how will we ever get result we want? That's why we need to use Disconnected tables in such scenarios so that the selection over the slicer doesn't filters our matrix before our measure is evaluated.
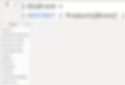
Below image shows the effect of slicer on the matrix when the column in slicer is coming from DisBrand[Brand]

Behind the scenes of the code generated by our report
I have imported the export of Performance Analyzer into DAX Studio to show how a visual is generated.
When Column from the Products table is used ( Read the comments in green color ):

Result:

When Column from the DisBrand table is used ( Read the comments in green color ):

Result:

Now that we have understood why we are using Disconnected table, let's try to make our code perfect by ensuring if in case there is no selection over the slicer then we atleast show something to the end user.
In this case I am going to show the Brand with the Highest sales.
The first variable is going to contains list of all the brands:
Then I need to get the Highest sales Amount amongst all brands, and for that I can use MAXX and call my measure in row context to initiate context transition:
Now let's find out which Brand is the Brand with the Highest Sales:
Next let's calculate sales by injecting these values into filter context and also ensuring we don't overwrite the existing filter context by using KEEPFILTERS:
This is how the final version of the code will look like:
Notice ISFILTERED? I have used it to check if there is selection on the slicer then I want the code that we wrote in the first part but if there is no selection then we want the Brand with the highest sales.
Here is how the the result looks like when there is no selection made on the slicer:

Possible Optimizations
Now as long as you have a selection over the slicer the internal code generated is extremely trivial because of the way we have written it, but if there is no selection over the slicer the code generated is pretty complex.
And that is because I have used multiple context transitions and the Storage Engine isn't able to cache the data and send it back to Formula Engine so that FE can iterate over those data caches, in an ideal scenario data cache are the desired behaviour but sometimes the query can be so complex that Storage Engine has to take help of Formula Engine for resolving the query and sometimes that is slower than pure Vertipaq ( SE ) query and that behaviour is know as CALLBACKDATAID.
DAX engines have multiple ways of answering a query:
Formula Engine ask for small data caches from Storage Engine and then Formula Engine decides how to evaluate those data caches, it can do a simple iteration, lookup between 2 or more data cache or even do a CROSSJOIN of 2 or more data cache
Storage Engine builds a full materialized table in memory and then give it back to Formula Engine, but that materialized (uncompressed) table can be so huge that it can take up a lot of space on the RAM, the Contoso Model I have used has 12.5 million rows and if Storage Engine materializes that table it will consume around 600-900 megabytes of my RAM, some of the functions that can create huge materialized table in memory are SAMPLE & GROUPBY
Engines know that the materialized version will be an expensive operation so Storage Engine calls Formula Engine for each row of the data and that's when we see CALLBACKDATAID it simply represents that the condition is too complex for Storage Engine so it needs help of Formula Engine.
You push most of the calculation to Formula Engine using the function that can't be solved using Storage Engine
Generally this is how the performance is ranked in the following order
Storage Engine sends/spools data caches then Formula Engine iterates data caches to answer the query
Storage Engine calls Formula Engine for resolving the DAX query row by row, for example using function that are not supported inside SE, one typical scenario is when you use DIVIDE function instead of / operator in a row context.
You push the maximum computation towards Formula Engine, for example by substituting SUMMARIZE with CROSSJOIN
Now moving on, here is the code generated for the visual when there is no selection over the slicer:
I have cleaned up the code to improve readability by removing ORDER BY clause and other stuff.
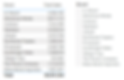
The above DAX query generates the following xmSQL ( pseudo SQL ) codes and contains Multiple CALLBACKDATAIDs:

First xmSQL Vertipaq query gets the Sales Amount by each Brand
Second xmSQL Vertipaq query is trying to get the MAX Sales becasue of the MAXX
Third xmSQL Vertipaq query is for the FILTER ( ALLBrands, [Total Sales] = BrandWithHighestSales )
Fourth xmSQL Vertipaq query does a kind of lookup in the previous xmSQL query
Finally above 2 quries are executed in Batch mode and the actual query executed is the following one which contains both of the last 2 queries:
Now how can we optimize this code? So, instead of initiating context transition multiple times what if we request everything at once and then use that single data cache to iterate and get the result? And for that we can modify the code and use ADDCOLUMNS contruct like the following one:
Now let's modify the rest of the code to use the result of this variable:
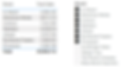
Let's see how it results in query performance:
Now only 2 queries are executed.

The first one gets the Sales Amount grouped by Products[Brand]
And the other one gets the Distinct Products[Brand] from the Products table
Now both the data caches are kept in memory to be used to answer any similar query that might come later, which improves the speed of the code.
After these data caches are spooled in memory the data caches are used by the Formula Engine to generate the result request by the original DAX Query.
The final optimized version of the code looks like the following:
Video explaining the Disconnected table but without the optimization part:
Let me know if you have any questions.