Fill Up and Down in DAX v2
- Antriksh Sharma

- Apr 10
- 3 min read
In an earlier blog post I showed how to implement Fill Up and Fill Down in DAX that relied heavily on using Calculated Columns.
However now that I have more experience with WINDOW functions I can show you a solution that does all of that with just measures.
But first I will introduce a simpler dataset that makes it easier to consume. The table contains only 3 columns.

These 3 columns together do not make up unique combination, the row (2025-02-01, null, null) is present twice at Row number 2 and 5, which is problematic because if we want to implement Fill Up or Down we will do so for each row but if we try to pass this table to Window function the engine will throw error regarding duplicate rows.
So the first rule of Window function is to make sure you don't pass in a table with duplicates, to avoid that I will add an Index column that guarantees each row is unique.

Next we need to split that table into clusters, basically North and South but into Numbers - 1 and 2 and 3 and so on.
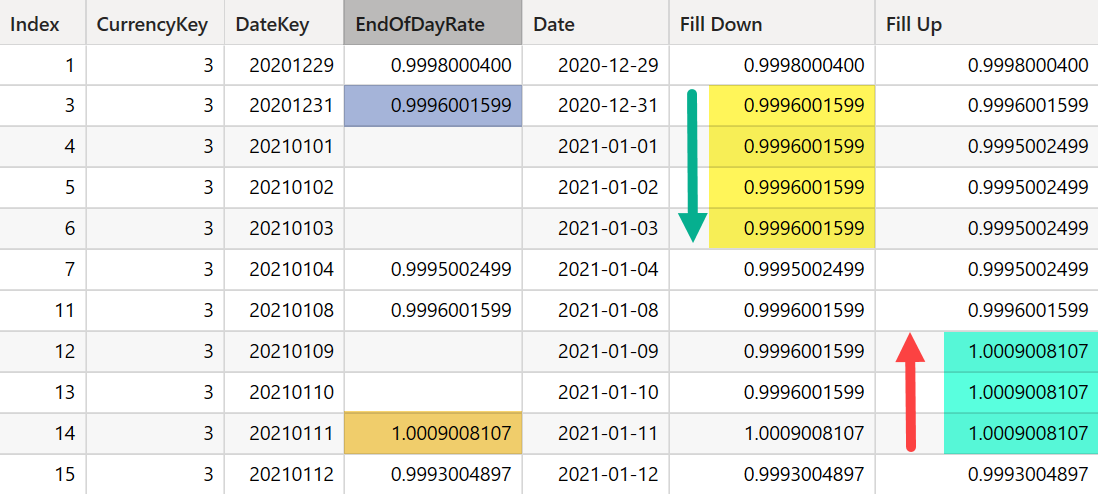
First we do Fill Down because that is how our eyes scan naturally. The following measure splits that table into 2 parts 1 and 2 the measure is CFD - Cluster for Fill Down.
CFD =
IF (
    ISINSCOPE ( Sales[Index] ),
    CALCULATE (
        COUNT ( Sales[Region] ),
        WINDOW (
            1, ABS, 0, REL,
            ALLSELECTED ( Sales ),
            ORDERBY ( Sales[Index], ASC ),
            MATCHBY ( Sales[Index] )
        )
    )
)
What we do here is by using WINDOW function we do a Rolling Count of Region, for first region every row will show 1, for second region we increment it and so on.

Once we have the CFD we can scan Sales and compute which cluster each row of Sales belong to.
FD Sales =
IF (
    ISINSCOPE ( Sales[Index] ),
    VAR CurrentCluster =
        [CFD]
    VAR FirstRowInCluster =
        INDEX (
            1,
            FILTER (
                ALLSELECTED ( Sales ),
                [CFD] = CurrentCluster
            ),
            ORDERBY ( Sales[Index], ASC ),
            MATCHBY ( Sales[Index] )
        )
    RETURN
        SELECTCOLUMNS ( FirstRowInCluster, Sales[Sales] )
)
We can be a bit more cautious by not iterating a table like Sales with many columns:
FD Sales 2 =
IF (
    ISINSCOPE ( Sales[Index] ),
    VAR CurrentCluster =
        [CFD]
    VAR CurrentClusterSales =
        CALCULATETABLE (
            FILTER (
                SUMMARIZE ( Sales, Sales[Index], Sales[Sales] ),
                [CFD] = CurrentCluster
            ),
            ALLSELECTED ( Sales )
        )
    VAR FirstRowInCluster =
        INDEX (
            1,
            CurrentClusterSales,
            ORDERBY ( Sales[Index], ASC ),
            MATCHBY ( Sales[Index] )
        )
    RETURN
        SELECTCOLUMNS ( FirstRowInCluster, Sales[Sales] )
)
What it does is row by row executes [CFD] to match it with CurrentCluster once we have it we sort it by Sales[Index] and INDEX grabs the first row available, which is always the first entry in the CurrentCluster.
In the same way you can Fill Down text field like Region as well:
FD Region =
IF (
    ISINSCOPE ( Sales[Index] ),
    VAR CurrentCluster =
        [CFD]
    VAR FirstRowInCluster =
        INDEX (
            1,
            FILTER (
                ALLSELECTED ( Sales ),
                [CFD] = CurrentCluster
            ),
            ORDERBY ( Sales[Index], ASC ),
            MATCHBY ( Sales[Index] )
        )
    RETURN
        SELECTCOLUMNS ( FirstRowInCluster, Sales[Region] )
)
Implementing Fill Up is simple once you have the logic for Fill Down implemented, all you need is to sort the Sales by Index in Descending Order and grab the First Row.

PBIX file:


Comments