Show values for last N months in DAX
- Antriksh Sharma

- Jan 3
- 7 min read
Updated: Jan 4
Today, I am going to explain how to show values in a Power BI visual but only for the last month or last N months.
Caveat: Sales for December of 2024 and 2025 have been removed.
The result we are interested in is the following:

To be able to build a measure like this one we first need to identify what is the Last Visible Date in the Filter Context?
VAR LastVisibleDate =
    CALCULATE (
        MAX ( Sales[OrderDate] ),
        ALLSELECTED ()
    )
This will return the max Order Date in the filter applied by the Slicer, then we need to build a list of dates that will only pertain to the last month in the visual, and for that we use DATESBETWEEN paired with EOMONTH to go to the last date in the previous month and then we increment it by 1 to get to the start of the current month.
VAR Period =
    DATESBETWEEN (
        Dates[Date],
        EOMONTH ( LastVisibleDate, - 6 ) + 1,
        LastVisibleDate
    )
Once we have these dates we can inject them into filter context with CALCULATE.
VAR Result =
    CALCULATE (
        [Sales Amount],
        KEEPFILTERS ( Period )
    )
And after this it is all about changing that 6 to either 1 or 2 or something else to control the number of months you want to show in the visual.
Last Month Sales =
VAR LastVisibleDate =
    CALCULATE (
        MAX ( Sales[OrderDate] ),
        ALLSELECTED ()
    )
VAR Period =
    DATESBETWEEN (
        Dates[Date],
        EOMONTH ( LastVisibleDate, - 1 ) + 1,
        LastVisibleDate
    )
VAR Result =
    CALCULATE (
        [Sales Amount],
        KEEPFILTERS ( Period )
    )
RETURN
    Result
So this solution used Time Intelligence functions to obtain a correct list of dates, but what about Vanilla DAX? For that we need a column in Dates table that acts as a Index but at Year Month granularity.
You can create such Index with the logic of Year * 12 + Month, equivalent of DAX will be
YEAR ( Dates[Date] ) * 12 + MONTH ( Dates[Date] )This column assigns a contiguous range of YearMonthNumbers that help in jumping back and forth with basic maths.
The column will look like this:

This time we first identify the LastVisibleMonth in the ALLSELECTED filter and there are many ways to achieve this.
VAR LastVisibleMonth =
    CALCULATE (
        MAX ( Dates[CalendarMonthIndex] ),
        CALCULATETABLE (
            SUMMARIZE ( Sales, Dates[CalendarMonthIndex] ),
            ALLSELECTED ()
        ),
        ALLSELECTED ()
    )
or
VAR LastVisibleMonth =
    CALCULATE (
        MAX ( Dates[CalendarMonthIndex] ),
        CALCULATETABLE (
            Sales,
            ALLSELECTED ( )
        )
    )
or
VAR LastVisibleMonth =
    CALCULATE (
        MAXX (
            SUMMARIZE ( Sales, Dates[CalendarMonthIndex] ),
            Dates[CalendarMonthIndex]
        ),
        ALLSELECTED ( )
    )
Once we have the value we can use it to filter the Dates table for a certain number of months:
VAR Result =
    CALCULATE (
        [Sales Amount],
        Dates[CalendarMonthIndex] >= LastVisibleMonth - 1
    )
and in case if you like separating the filtering logic you can have a new variable named Period:
VAR Period =
    CALCULATETABLE (
        VALUES ( Dates[CalendarMonthIndex] ),
        Dates[CalendarMonthIndex] >= LastVisibleMonth - 1
    )
Full code:
VAR LastVisibleMonth =
    CALCULATE (
        MAX ( Dates[CalendarMonthIndex] ),
        CALCULATETABLE (
            Sales,
            ALLSELECTED ( )
        )
    )
VAR Period =
    CALCULATETABLE (
        VALUES ( Dates[CalendarMonthIndex] ),
        Dates[CalendarMonthIndex] >= LastVisibleMonth - 1
    )
VAR Result =
    CALCULATE ( [Sales Amount], Period )
RETURN
    Result
Now the issue with these 2 codes is that if you were trying to show 3 months but a month in between didn't exist in the Fact table then you will not show values for 3 months.
As you can see in the following image now I have removed Sales for October 2024, it only shows values for Month = 11 but not for 9 since 10 is missing, whereas in the code I am trying to show for last 2 months.

Good news! This limitation can be easily resolved with WINDOW functions that do not rely on maths for moving back and forth instead they rely on the concept of CURRENT ROW with the help of which it can jump back and fort.
First we generate the SourceTable which is a very important aspect of WINDOW functions, because if the input table is not correctly structured then the engine will generate CURRENT ROW(s) that are not required and results will vary.
VAR SourceTable =
    CALCULATETABLE (
        SUMMARIZE ( Sales, Dates[CalendarMonthIndex] ),
        ALLSELECTED ( Dates )
    )
SourceTable variable provides only those CalendarMonthIndex that exists for the currently selected year in the Sales table.
VAR Period =
    WINDOW (
        1, ABS,
        2, ABS,
        SourceTable,
        ORDERBY ( Dates[CalendarMonthIndex], DESC )
    )
Period variable helps in generating a WINDOW of 2 months for each cell in the visual based on the SourceTable that we have provided.
VAR Result =
    CALCULATE (
        [Sales Amount],
        Period
    )
Then we inject that WINDOW into filter context and evaluate the result, which returns 2 months even though 1 month in between is missing.

As you can see this version of code can return values for 2 months even though October is missing in the Sales table.
The reason is simple we prepared a table of 2 rows ordered in Descending order and then injected them into filter context, and since in the Visual we have Year and Month we do not see 40,329 for 9 & 11 as the cross filter from Year and Month is already intersecting with the SourceTable, otherwise if CalendarMonthIndex was in the visual we would have to use KEEPFILTERS.
With Window functions the SourceTable needs to carefully prepared as they work by traversing relative to the CURRENT ROW after filtering the SourceTable in Row and Filter context, this is the reason why I used SUMMARIZE ( Sales, Dates[CalendarMonthIndex] ).
And as you can see from the following image the SourceTable we supplied contains only months that are available in Sales, that's why 1, ABS, 2, ABS, return 24299 and 24297 otherwise if we used VALUES ( Dates[CalendarMonthIndex] ) then we would have returned 24300 and 24299.

Now for SSAS Tabular 2022 where WINDOW functions aren't available yet, we can use TOPN
VAR SourceTable =
    CALCULATETABLE (
        SUMMARIZE ( Sales, Dates[CalendarMonthIndex] ),
        ALLSELECTED ( Dates )
    )
VAR Period =
    TOPN (
        2,
        SourceTable,
        Dates[CalendarMonthIndex],
        DESC
    )
VAR Result =
    CALCULATE ( [Sales Amount], Period )
RETURN
   Result
We can also do this with Visual Calculations, but so far I am unable to show 40329 at the grand total and Year subtotal, hopefully in future I will be able to understand why.
So when we work with Visual Calculations we are always at a certain level and in our report we have 2 levels Year and Month, now at each cell we only have access to 1 row so the problem at hand is how do I get more than 1 row in the current cell? For that we have to use functions that Increase or Decrease the granularity of the Visual Context and we have 4 functions - COLLAPSE, EXPAND, COLLAPSEALL, EXPANDALL.
Now for these functions to work they need access to a fixed table that is predefined and that's how Visual Calculations work, this table is created behind the scenes by the visual with the help of SUMMARIZECOLUMNS and the new WITH VISUAL SHAPE keywords.
Our visual executes the following DAX Query that results into a table that is further used by the Visual Calculations.
VAR __DS0FilterTable =
    TREATAS ( { 2025 }, 'Dates'[Year] )
VAR __DS0Core =
    SUMMARIZECOLUMNS (
        ROLLUPADDISSUBTOTAL (
            'Dates'[Year], "IsGrandTotalRowTotal",
            'Dates'[Month], "IsDM1Total"
        ),
        __DS0FilterTable,
        "Sales_Amount", 'Sales'[Sales Amount]
    )
Then Visual Calculation feature interacts with it to identify what needs to go at a certain place in the visual.
TABLE '__DS0VisualCalcs' =
    __DS0VisualCalcsInput
    WITH VISUAL SHAPE
    AXIS ROWS
        GROUP [Year]
            TOTAL [IsGrandTotalRowTotal]
        GROUP [Month]
            TOTAL [IsDM1Total]
        ORDER BY
            [Year] ASC,
            [Month] ASC
    DENSIFY "IsDensifiedRow"
As you can see from above on the ROWS we have [Year] and [Month] and it identifies the GrandTotal through [IsGrandTotalRowTotal] and subtotals through [IsDM1Total]
Now this table is utilized for the new functions such as COLLAPSE and EXPAND to go to a level that has more or less detail.
COLLAPSE let's you collapse the Visual to a level where the specified column is no longer visible so if you start with a table that Contains Year, Month, Date, SalesAmount and you do COLLAPSE ( [Date] ) then it will internally obtain a table that has Year, Month, SalesAmount.
On the other hand if you use EXPAND ( [Date] ) but you are at [Year] Level then it will return a table that contains Year, Month, Date, SalesAmount so that you can perform aggregations on the rows, that's why you will notice that with EXPAND you need aggregation function but with COLLAPSE you don't.
So coming back to the challenge at hand, when we are at month we need more than 1 month to be able to execute the WINDOW function so for that we will use EXPANDALL/EXPAND.
VAR SourceTable =
    CALCULATETABLE (
        SUMMARIZE ( ROWS, [Year], [Month] ),
        EXPANDALL ( ROWS )
		-- EXPAND ( [Month] )
    )
For this example both work but EXPANDALL may give you more granularity if there are levels below [Month] in your visual. This code returns 66 rows if there is no active filter in the slicer

but only 10 months if I select 2024.

Then we compute the 2 months that we need with WINDOW.
VAR Period =
    WINDOW (
        1, ABS,
        2, ABS,
        SourceTable,
        ORDERBY ( [Month], DESC ),
        PARTITIONBY ( [Year] )
    )
And the we compute the sales for those 2 months only
VAR Result =
    CALCULATE (
        SUM ( [Sales Amount] ),
        KEEPFILTERS ( Period )
    )
Complete code:
Last Month VC =
VAR SourceTable =
    CALCULATETABLE (
        SUMMARIZE (  ROWS, [Year], [Month] ),
        EXPANDALL ( ROWS )
		-- EXPAND ( [Month] )
    )
VAR Period =
    WINDOW (
        1, ABS,
        2, ABS,
        SourceTable,
        ORDERBY ( [Month], DESC ),
        PARTITIONBY ( [Year] )
    )
VAR Result =
    CALCULATE (
		SUM ( [Sales Amount] ),
		KEEPFILTERS ( Period )
	)
RETURN
    Result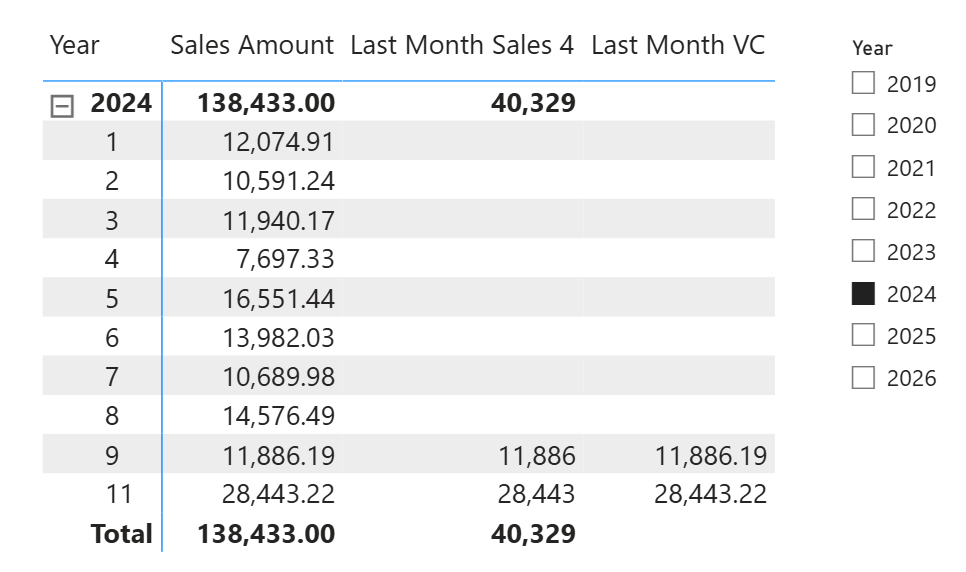
Now the only challenge I face is I am unable to compute the subtotals and grand total for Visual Calculations, and I have tried way too hard, but I guess in future I maybe able to figure out. If you know how to fix this, then please let me know.
In the next blog I will show you how to do the same thing but for all the years or just selected years with different techniques.


Comments